


Cardiologists have an AUC of 0.81 with each other
Even worse R2 and other fun facts about clinical variability

One of the most foundational measurements of heart function is left ventricular ejection fraction (LVEF). For the non-clinicians, it’s a ratio of volumes between before and after a heart beat (end-systole and end-diastole) and a metric of how well the left ventricle (the chamber that pumps blood to the body) functions. It’s so important, that it defines entire classes of diagnoses (heart failure with reduced ejection fraction and heart failure with preserved ejection fraction). This is measured in almost every imaging modality of the heart (nuclear medicine, CT, MRI, and last but not least echocardiography) and also part of the reason why there are efforts to try to predict this measure even without imaging or with AI during other diagnostic tests. As an imaging cardiologist, its the measure we report most often, and probably the diagnostic measurement that most impacts patient care (this measurement directly impacts the medications and implanted cardiac devices a patient might get). You’ll have to make my word for it (as it’ll probably be another post), but this is also one of the measures imaging cardiologists are best at measuring and oftentimes the most reliable measurement in an echo report).
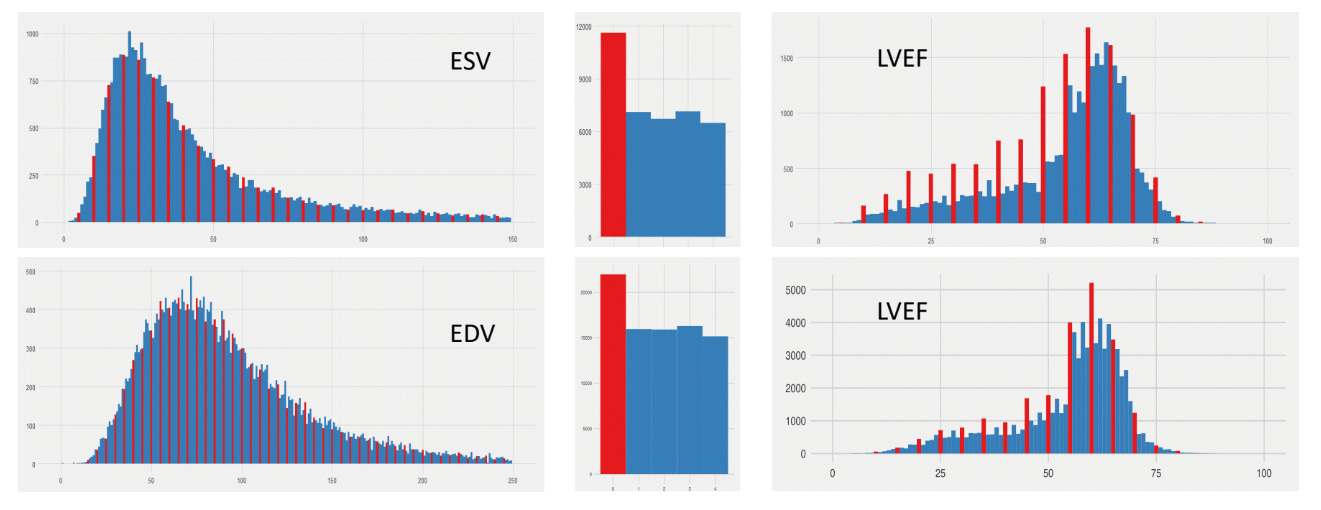
Yet there is non-insignificant clinical variability. I begin many of my talks with the figure above, which is the distributions of LVEF across two large academic medical center echocardiography labs (across ~30 years and ~1M studies). In these two echo labs that I’ve worked in, across a large population you see a fairly smooth distribution of end-systolic volumes (ESV) and end-diastolic volumes (EDV) - the upstream measurements that define the calculation of LVEF. Yet when you look at LVEF, one notices that the distribution is no longer so smooth - its quite spiky when its LVEFmod5 = 0 (when LVEF ends in 0% or 5%). And this is true even on the exact same patients - when one looks at patients only when ESV, EDV, and LVEF are all reported together. However, humans are not Minecraft characters with discretized or blocky measurements. Why does this exist?
There is inherent uncertainty in imaging measurements, and while many measurements are calculated to many significant figures, the preference for human clinicians for nice round numbers reflect both uncertainty and hedging (maybe I want the LVEF to be above 35%, maybe I don’t, but maybe I give some leeway to the referring clinician who is actually taking care of the patient). Either way, there’s enough variation in how images are acquired and measured to provide leeway to the imaging cardiologist to reflect variation.
Paradoxically, this makes writing ML papers in imaging hard - there’s an inherent upper bound on the performance of AI algorithms trained on human labels, and why there’s clearly shenanigans when the AUC or R2 is unrealistically high. (Intuitively, lets pretend we have a perfect AI model and the correlation between clinician A and clinician B is 0.85. If an AI model’s correlation is perfect with clinician A (the R2 is 1 for the perfect algorithm), the exact same AI would have an R2 with clinician B would be 0.85.) How are we so lucky to have chosen clinician A as our ground truth? Why is it that industry sponsored papers tend to have higher R2 than non-industry sponsored papers?
What is good performance vs. unrealistic performance ?
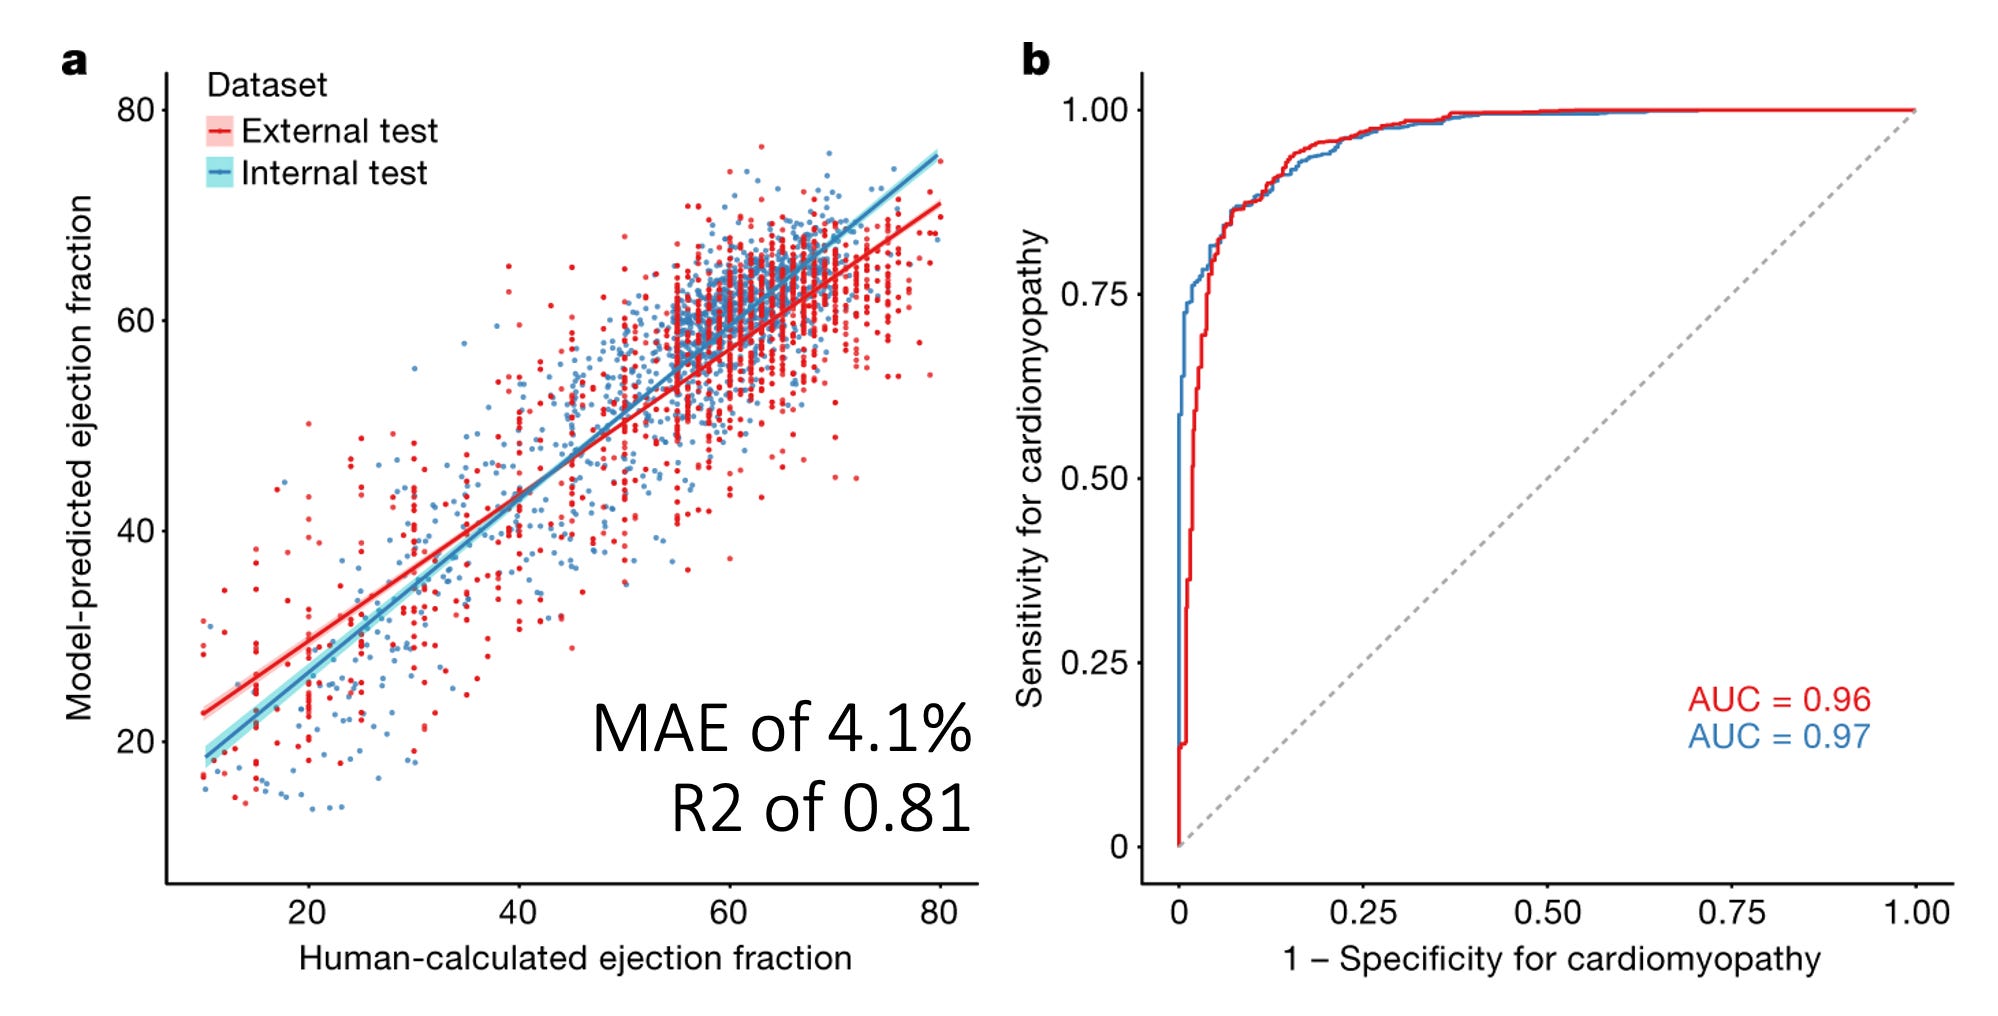
In 2020, we published a video-based AI model for assessing LVEF from the echocardiogram videos. Using this model, we showed that both in internal and external held out test datasets, we achieved a mean absolute error (MAE) from the cardiologist label of approximately 4.1 percentage points of LVEF and this corresponded to an R2 of approximately 0.81. (As an aside, this gives you the rough estimate of what MAE maps to what R2 when it comes to LVEF, more about that soon). When binarizing the outcome to the ability to predict whether the LVEF was above/below 50%, this resulted in an AUC of 0.96 - 0.97. But to put this in perspective, is this any good? How does this compare with salt-of-the-earth clinicians? The cardiologists and sonographers who actually do this day in and day out? Actually we can calculate their AUC and R2 as well!
Calculating the R2 and AUC of sonographers
*** Brief aside *** I’ve generated a few figures for this post and I’m making it publicly available. The code is here, and for the data for this analysis from our blinded, randomized clinical trial of AI, for which we’ve publicly shared the deidentified patient-level trial data here. No paywall and you don’t even need to email me or any other investigators for access! (Would appreciate it though if you cite the paper.)
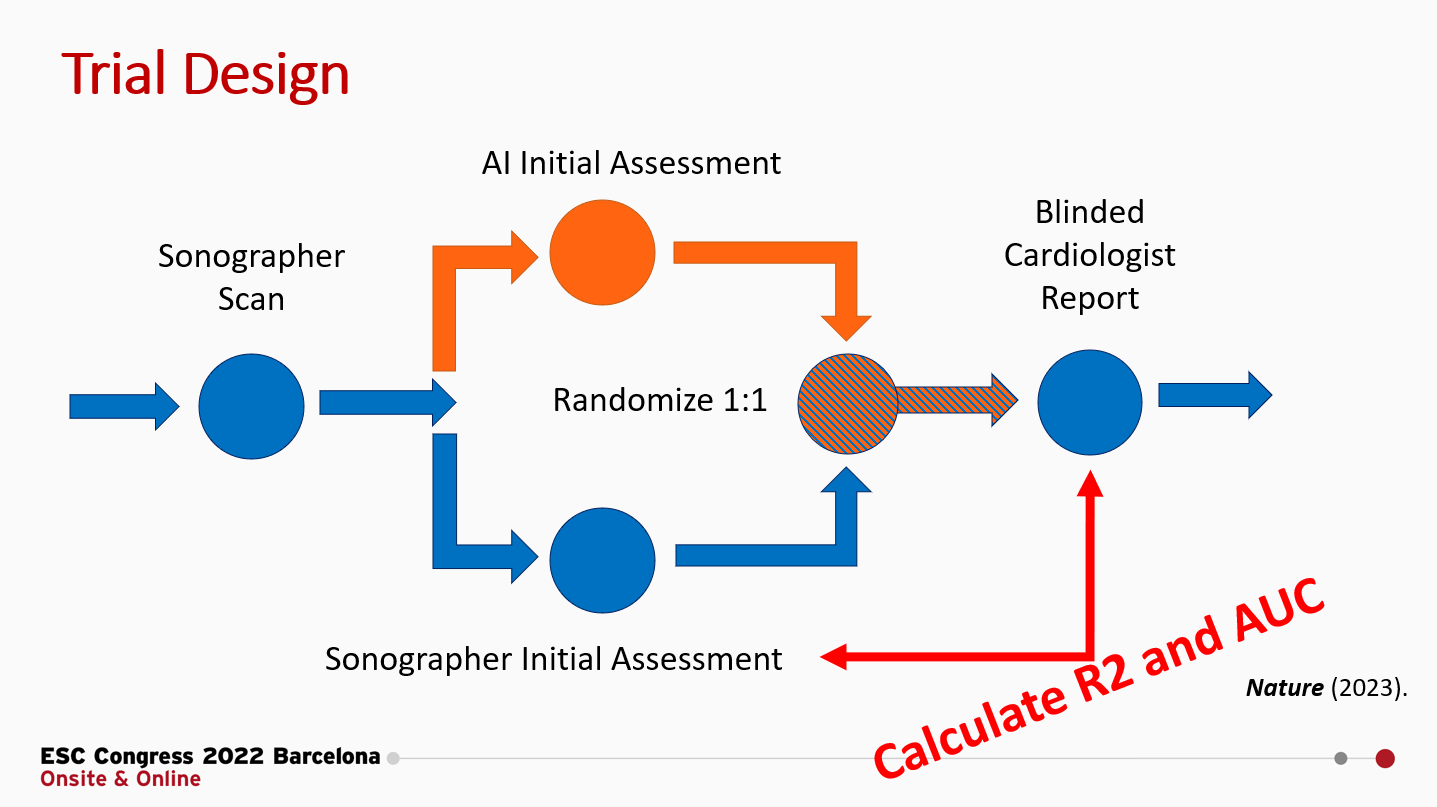
The brief summary of our RCT is that we randomized cardiologists to initial assessment of LVEF by AI or sonographer and measured how much they changed the initial assessment to produce their final LVEF assessment. In this setting, where the cardiologists could see the tracing but did not know the agent of initial interpretation, we reported that the MAE for sonographers to final cardiologist LVEF was 3.77 percentage points, but we didn’t report the R2 or AUC. Let’s do that now (figure below). Expert sonographers have an R2 of 0.82 and an AUC ranging from 0.92 - 0.98.
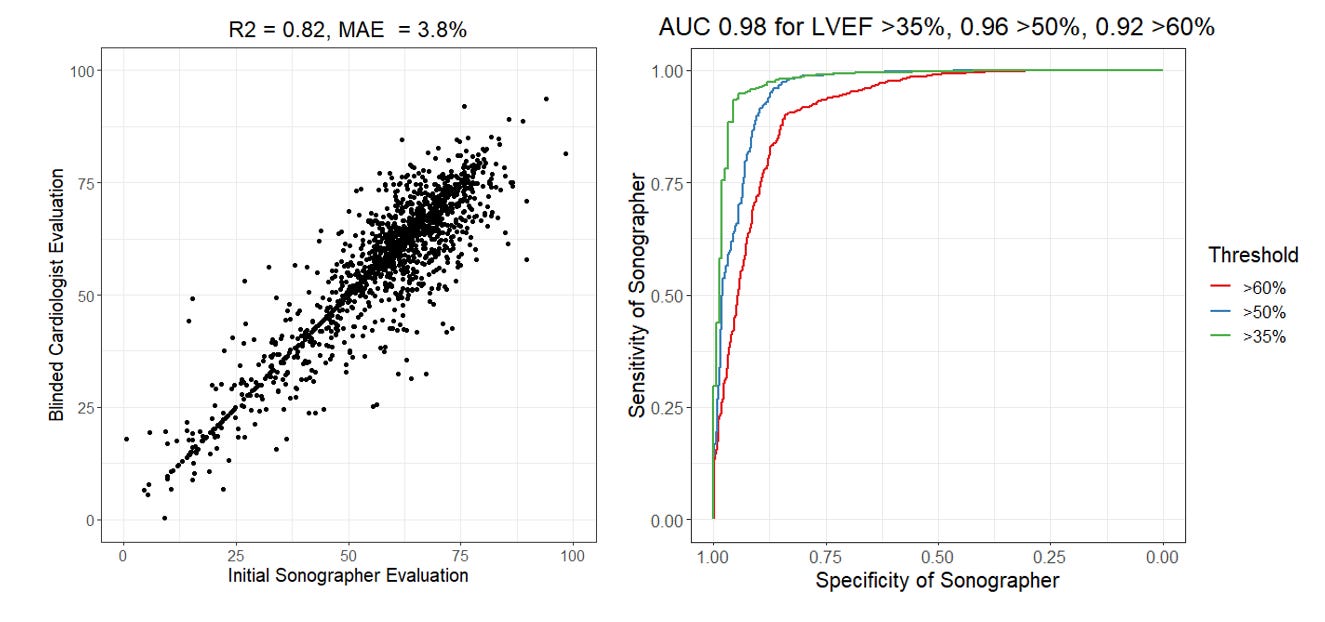
Was that higher or lower than you expected? There’s a couple of things to note in this analysis. First, the AUC is actually dependent on what threshold one decides for evaluation. The AUC is always higher for more extreme phenotypes (AUC of 0.98 for LVEF above or below 35%) as there’s more consensus and less heterogeneity when it’s a more obvious presentation. Second, this comparison is done with the cardiologist seeing the initial assessment and being asked to change or create a new tracing if they disagree). In our trial, approximately 30% of these studies were not changed and the cardiologist just went with the preliminary assessment. This likely due to an element of anchoring bias (when it’s “good enough”, human clinicians might feel like it’s too much effort to change it and accept it as is. See the points on the scatterplot where x = y). You do not see this effect when humans are asked to do this independently and not given a guide or prompt.
Calculating the R2 and AUC of cardiologists

Now, bwhahaha (mad scientist cackle), lets calculate the performance of cardiologists. A key feature of our RCT that I’m proud of in terms of design, was that the trial designed to allow the largest measurement-remeasurement test of expert clinicians but using a set of imaging studies that have already previously been measured by sonographers and cardiologists. Prior studies have sought to answer the question of clinical variability, but often with only hundreds of samples rather than the 3,495 studies in our trial. Rather than framing it as a question of clinical variance (which is how I often talk about it), let’s be a little tongue in cheek and calculate the performance metrics of cardiologists by using one cardiologist as “ground truth” and the other cardiologist as the method to test. With this in mind, we’ve previously reported the MAE between cardiologists was are 6.3 to 7.2 percentage points, but that means the R2 of a cardiologist is actually 0.64 and the AUC of a cardiologist is between 0.81 and 0.97. Take that, AI models?

Wow. What does that mean? Why is the cardiologist R2 and AUC lower than the sonographer R2 and AUC? First, I want to emphasize that this MAE is absolutely consistent with prior studies (1, 2, 3) and I’m not out here trying the malign the good name of imaging cardiologists. With this large blinded trial, I would argue this is the best point estimate with the largest sample size/smallest error bars. But, second and importantly, this is the difference between a blinded study vs. unblinded study and prompted study vs. unprompted study. There is much more heterogenity when unprompted and independently tested. Without knowledge of the historical LVEF and done independently, it’s very natural to have variation of this range in measurements that depend on choosing views, frames, contours, and many other details. This degree of variation is equally true in cardiac MRI and other imaging modalities as well. Time and time again, we see that anchoring bias is very real and has a big impact even when AI is incorrect. (Also, why I will always say the sonographers are the most important members of the echo lab team, but that’s probably the topic of another post).
Finally, I want to spend a few moments on the topic of AUCs, recognizing the AUC of cardiologists can range from 0.81 and 0.97 in the same dataset. Generating an AUC is the equivalent to binarizing the ground truth labels and stack-ranking the model outputs and comparing them with the binarized label. It’s incredibly important to recognize how the choice of threshold can impact performance metrics. (This also why some papers use a cut off of 35% rather than 50% for LVEF for heart failure prediction models, cough cough, as more extreme phenotypes are easy to predict. ) My intuition for why the AUC is 0.81 for a threshold LVEF of 60% vs. an AUC of 0.91 for a threshold LVEF of 50% is simply - it’s much more clinically meaningful for diagnosis and treatment to distinguish between a patient with an LVEF of 46% vs. 54% rather than an LVEF of 56% vs. 64%. The first example is the difference between starting a patient on ~4-5 new medications or not while the second example is a curio of an imaging report. Naturally clinicians put more effort and though into making the first distinction rather than the second comparision. As an echocardiographer, I think about the patient’s LVEF much more when it’s a cardio-oncology patient and the different is between stopping or continuing chemotherapy.
What does this really mean?
“There are three kinds of lies: Lies, Damned Lies, and Statistics” - Mark Twain
Having majored in statistics, I like this quote. To the first approximation, its true! There’s an incredible amount of unappreciated complexity and subjectivity in statistical analysis and data visualization that doesn’t casually come across because it’s under the veneer of math. There’s many ways to be subtle, persuasive, or informative that guides a reader to a conclusion. (This is similarly true with clinical trial design). With this context in mind, I’m inherently suspicious of studies with unusually high R2 and AUCs. It’s like submitted a paper where you report you flipped a coin a hundred times in a row and all got heads. This can happen - if you cherry pick the data, do the analysis unblinded, or “financially incentivize” the ground truth, but I’d probably want a few more details. Similarly, I’d do a little more digging before purchasing an AI solution.
That will be the topic of my post in two weeks - how do you critically evaluate an AI model? (Beyond the marketing press and reported metrics, which we show how it can be gamed.) Next week, I’ll steelman the negative case for LLMs in medicine.