An Intro to EchoCLIP, a Multimodal Foundation Model for Echo (Guest Post)
This post is by Kai Christensen, a talented AI researcher, filmmaker, and artist on the team. Check him out at mkaic.blog or follow him on Twitter.
I am an AI researcher, and I work at the CVAIR (CardioVascular AI Research) lab at Cedars-Sinai. I just finished a research project, and have written a paper about it. This blog post is a more approachable version of that paper — one without all the silly academic gobbledygook, meant to be accessible to people outside of my field who know nothing about cardiology.
One of the most common ways to study the heart is with echocardiography, or heart ultrasound. It’s like a pregnancy ultrasound, but instead of pointing the wand at a baby, you point it at a beating heart.
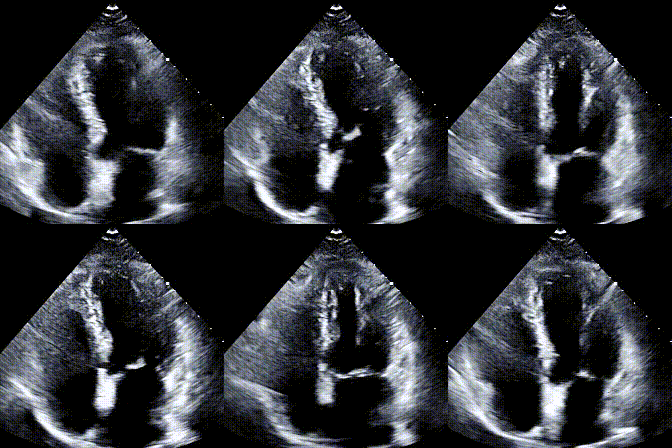
Echocardiograms, or echos, are black-and-white videos of a cross-section of a heart. The angle you choose to hold the wand at relative to the patient’s heart determines what “slice” of the heart you can see. The most common angle is called the Apical 4-Chamber View (A4C), and as the name suggests, it lets you see all 4 chambers of the heart at once, beating in real time. Here’s an example:
Typically during a heart study, the ultrasound operator, or sonographer, will capture around 100 echo videos from different views, including A4C. Later, a cardiologist like my boss will “read” these echos and write a report about the state of the patient’s heart. The report usually contains answers to questions like:
“Is the heart beating with a steady rhythm?”
“Does the patient have any heart implants?”
“Are the chambers of the heart unusually dilated?”
“How efficiently is the heart moving blood with each beat?”
“Are the valves opening and closing fully and at the proper times?”
“Are the walls of the heart unusually thick or thin?”
There are many other pieces of information in these reports too—they’re quite detailed. Echo reports are used to make important decisions about medications, surgeries, and risk. Because they’re so common and useful, over 300 thousand of them are stored in our hospital’s database. The database also stores the millions of videos the reports were written about!
Okay, let’s take inventory. We have access to millions of ultrasounds of people’s hearts, and hundreds of thousands of detailed reports which describe the contents of those videos. The reports essentially distill the most important features from the videos into a much more compact form. AI being my job and all, my immediate reaction to this inventory is to ask:
What sort of AI model could we train using this data?
Well, one popular model to train with large datasets of text and images is a CLIP model. In AI we have models that are good at processing text, and models that are good at processing images. But things get tricky when you want to process both text and images, because they have very different formats and information densities.
CLIP (“Contrastive Language Image Pretraining”) is a method proposed by OpenAI a few years back for training two separate models (one for text, one for images) to project images and text into a “unified latent space.” If you think of images and text as two different languages, CLIP links the two together by translating both of them into a common third language.
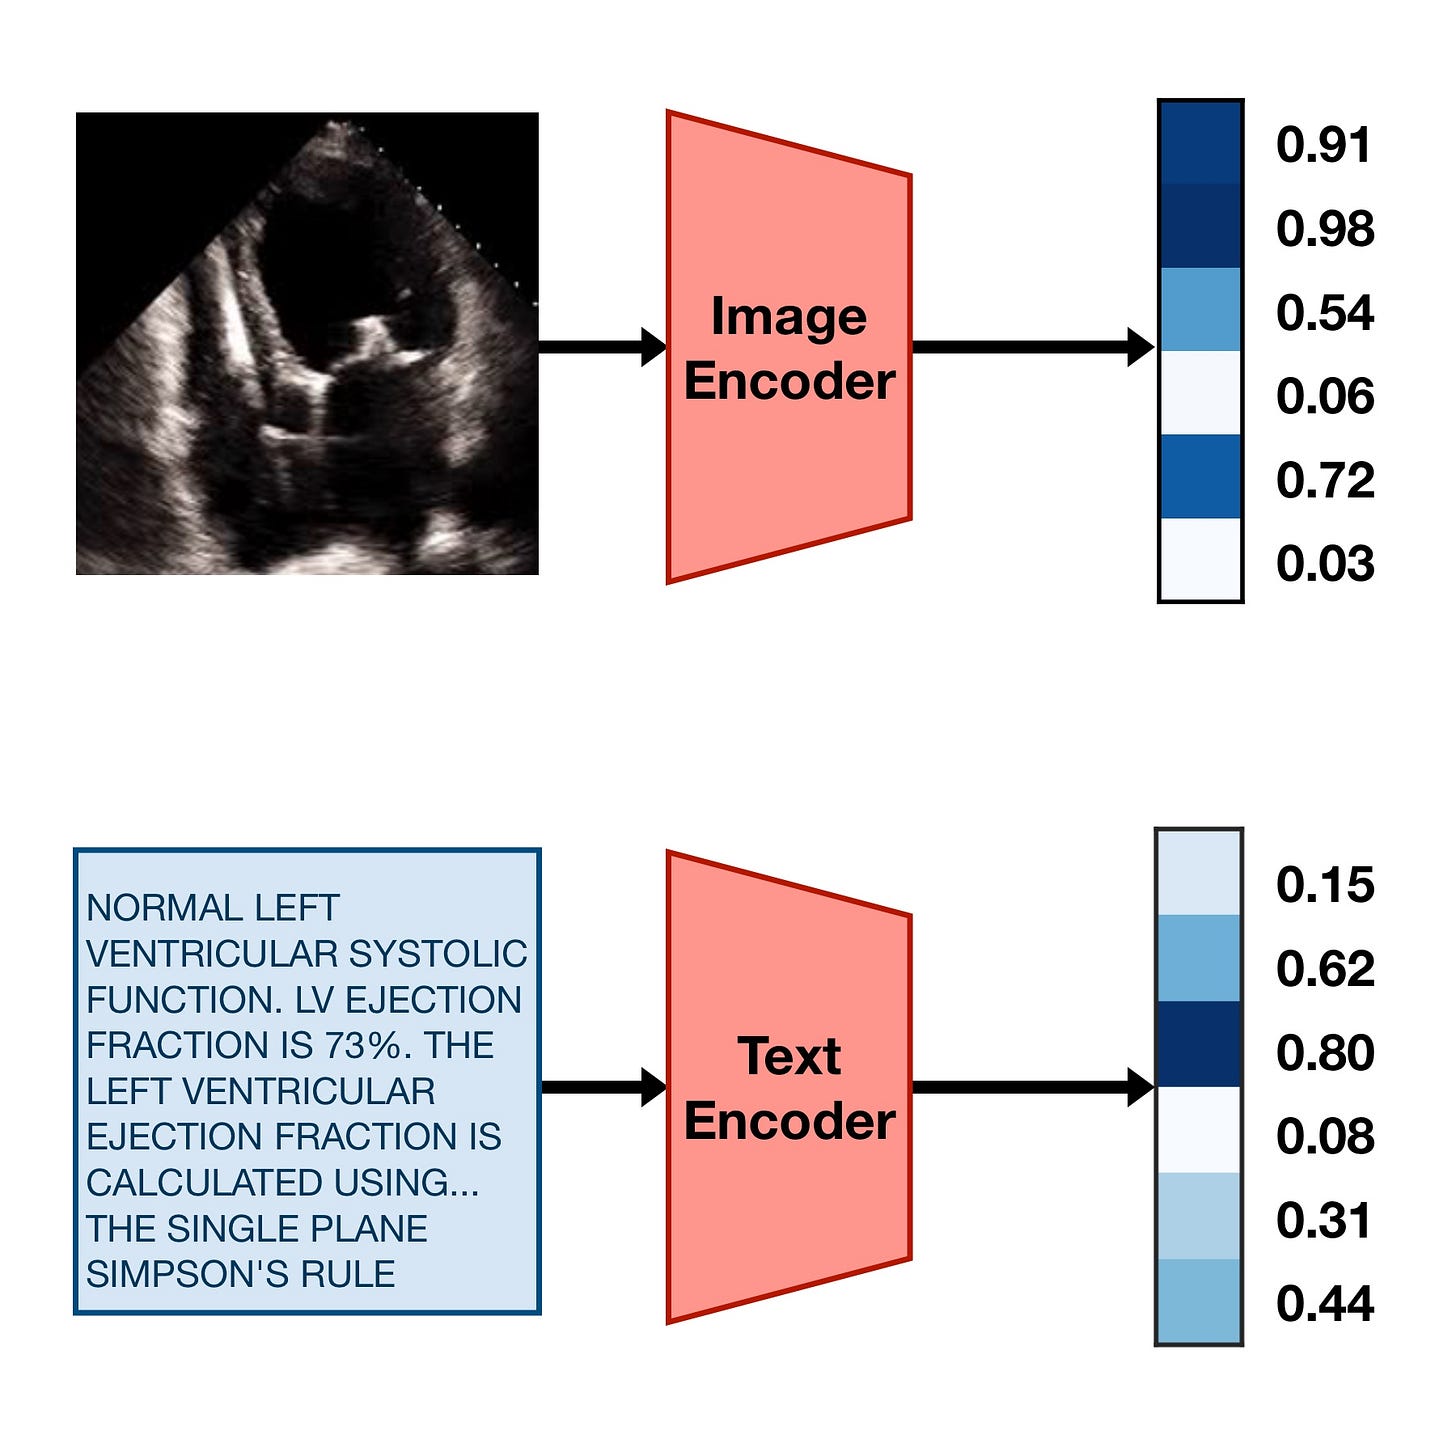
To train a CLIP model, you need a text encoder model and an image encoder model. The job of these two models is to take their respective inputs and turn them into strings of numbers (“embeddings”) that encode their high-level semantic features, like this:
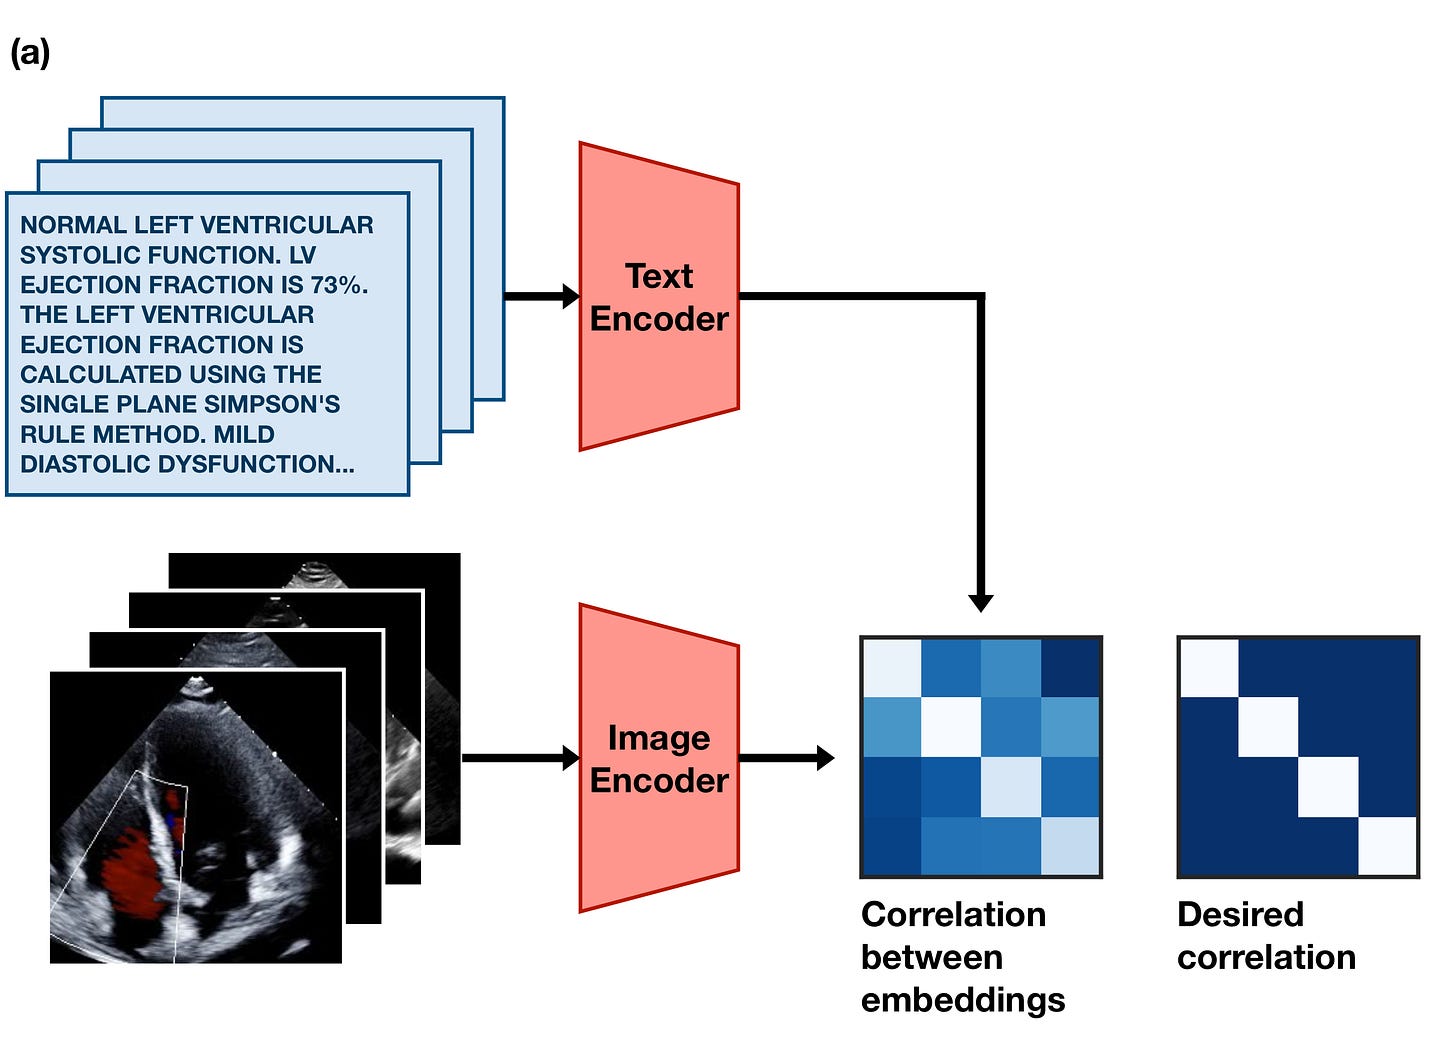
In order to make these embeddings useful for something, we can train the image encoder and the text encoder with the following goal:
If an image and caption are paired, their embeddings should be similar to each other. If they aren’t paired, their embeddings should be dissimilar to each other.
This simple training goal forces the image encoder and text encoder models to learn to agree upon a single common representation of the information inside the images and text. In practice, this means the embeddings they produce often act as a sort of compressed description of the meaning of the text or image. Diagrammed, the goal looks something like this:
CLIP was originally introduced by OpenAI a few years ago. In their paper, they trained a CLIP model on a big dataset of 400 million images and captions scraped from a number of websites. They showed that they could then use the trained model to classify images from a standard benchmark called ImageNet, despite the model never training on these images. This is pretty cool — it shows that the model has some level of “understanding” of the meaning of text and images.
As cool as it is, though, the original CLIP model wasn’t trained on very much medical data, which means it doesn’t produce very useful embeddings for echocardiograms. Medical data is, after all, hard to get — and even harder to get lots of. And even if you’ve got lots of medical data, you might need specialist knowledge to work with it properly. Luckily, I have a lot of medical data and access to specialists!
So, I trained an image encoder and a text encoder on one million pairs of A4C echo videos and reports, following the approach of the original CLIP paper with a few minor tweaks. I made a fork of the awesome OpenCLIP project to do this. To conserve GPU memory, we chose single random frames from the videos and random small snippets of the reports to process instead of processing the entire video or entire report.
After a few days of melting the lab GPUs, the models (which are collectively named EchoCLIP) finished training. All that was left to do was to figure out how to use it for cool downstream tasks and analyses.
The first test I tried was to use the model to predict the ejection fraction of hearts in the test set. Ejection fraction is a percentage that describes how efficiently the heart pumps blood — 100% means that every time the left ventricle squeezes, it squeezes out all the blood inside it, while 0% means it squeezes none of the blood inside it. Most healthy people have a resting ejection fraction of around 50-60%. Having an ejection fraction lower than 50% usually indicates heart failure.
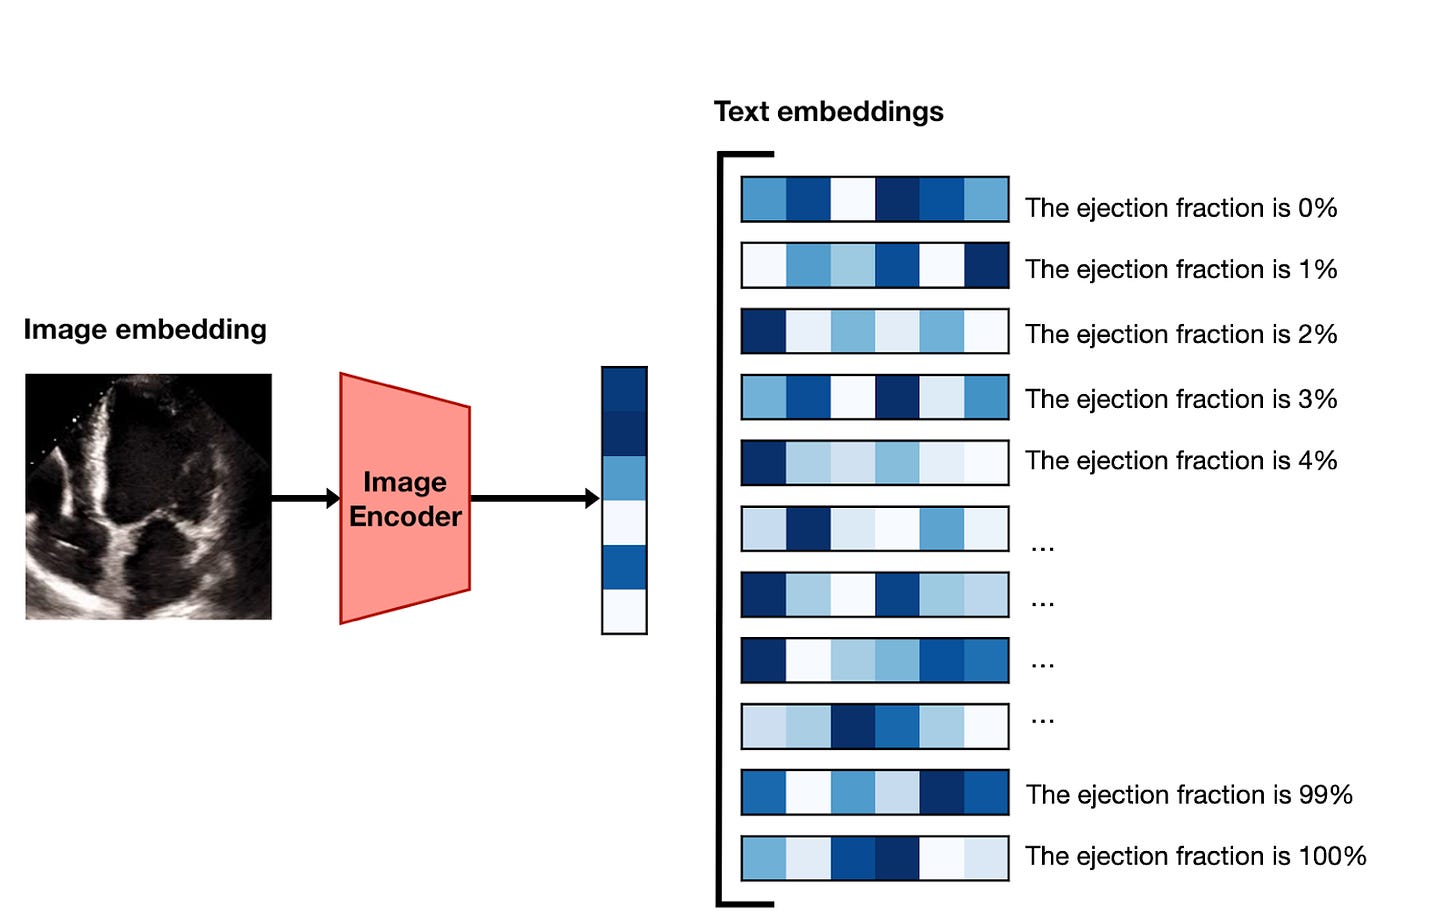
If you’re following along, you might be curious how it’s possible to take two models that turn text and images into embeddings, and use them to predict a continuous value like ejection fraction. The gist1 of the method is as follows:
Using the image encoder, embed a frame of the video.
Generate versions of the prompt “Ejection fraction is estimated to be X%” for the whole range of integers between 1 and 100.
Encode each of these 100 prompts with the text encoder to turn them into embedding vectors.
Sort the prompt embeddings according to their similarity with the image embeddings, and take the top-ranked value as the prediction.
Do this for 10 different frames and average the results.
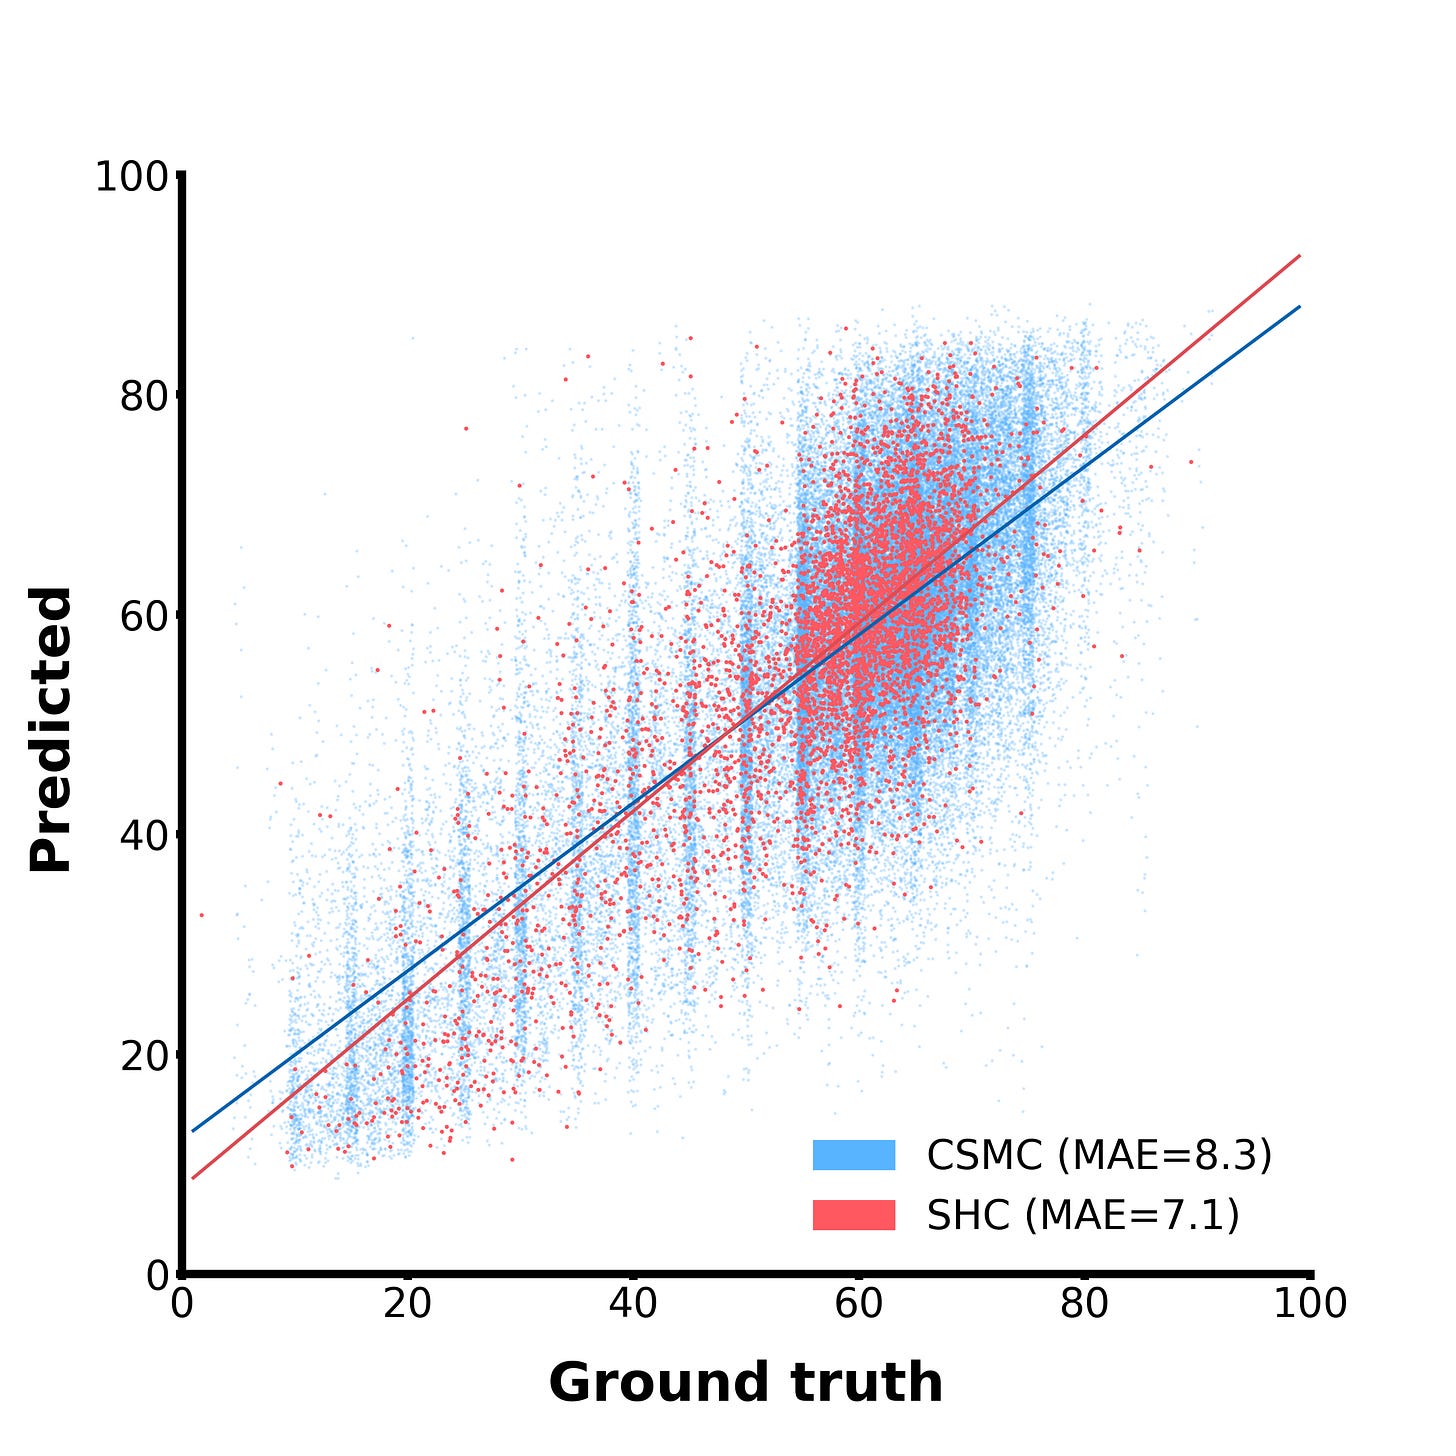
This is getting a little too into-the-weeds, so for now, let’s just look at how well it works:
And… it works well! In this scatterplot, the blue dots are examples from our internal test set, while the red dots come from an entirely different hospital and serve as external validation. Our model can clearly zero-shot-predict ejection fraction, and decently well too. For reference, the mean difference between two human experts on this task is around 7-10%, so we’re not awfully far off from human-level performance! This is neat because the models was not explicitly trained to do this, but it learned to do it out of necessity to satisfy the simple, broad training objective given to it.
The other tests we ran on the model included a few binary classification tasks. The setup for binary classification is simpler than predicting a continuous value like ejection fraction, but uses a similar approach:
Embed the first 10 frames of the video.
Embed a report snippet, something like “Heart shows signs of Condition XYZ” or similar.
Calculate the similarities between the frame embeddings and the text embedding, then average them.
Threshold this average similarity to produce a final binary prediction.
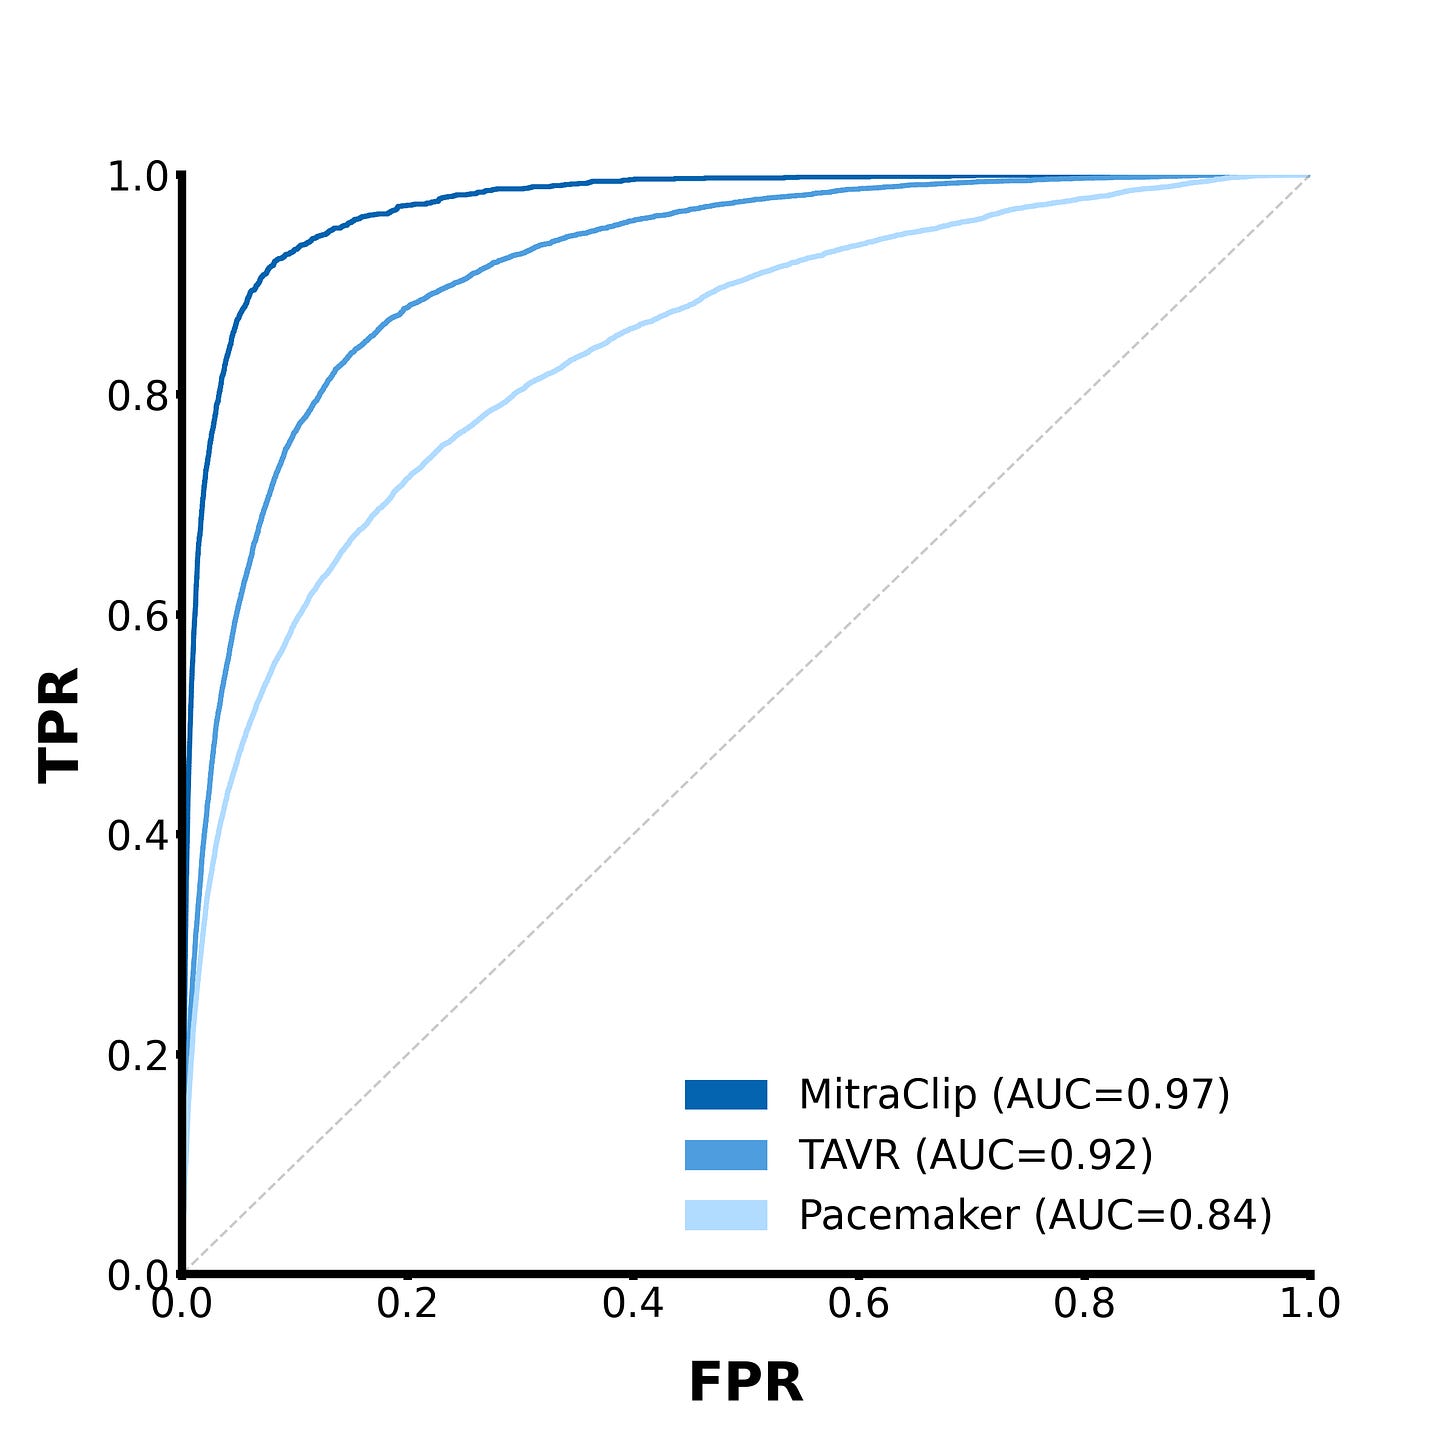
A common way of measuring the performance of a binary classifier is to try a range of different threshold values and plot their true/false positive rates as a curve like this
This is called a Receiver Operating Characteristic (ROC) curve, and it plots the model’s true positive rate against its false positive rate on a range of possible binarization thresholds. A perfectly accurate classifier would have a curve that sticks exactly to the top left corner of the plot, meaning the true positive rate is always 100% and the false positive rate is always 0%. Meanwhile, a purely random classifier will produce a diagonal line, which indicates that changing the threshold introduces false positives as quickly as it introduces true positives. If you take the Area Under the Curve (AUC) of an ROC curve, it will be 1.0 if the classifier is perfect, and 0.5 if it’s totally random. If the AUC is less than 0.5, that means your model is performing worse than random.2 So the AUC of an ROC curve is a good general metric for determining how good a model is at classifying stuff.
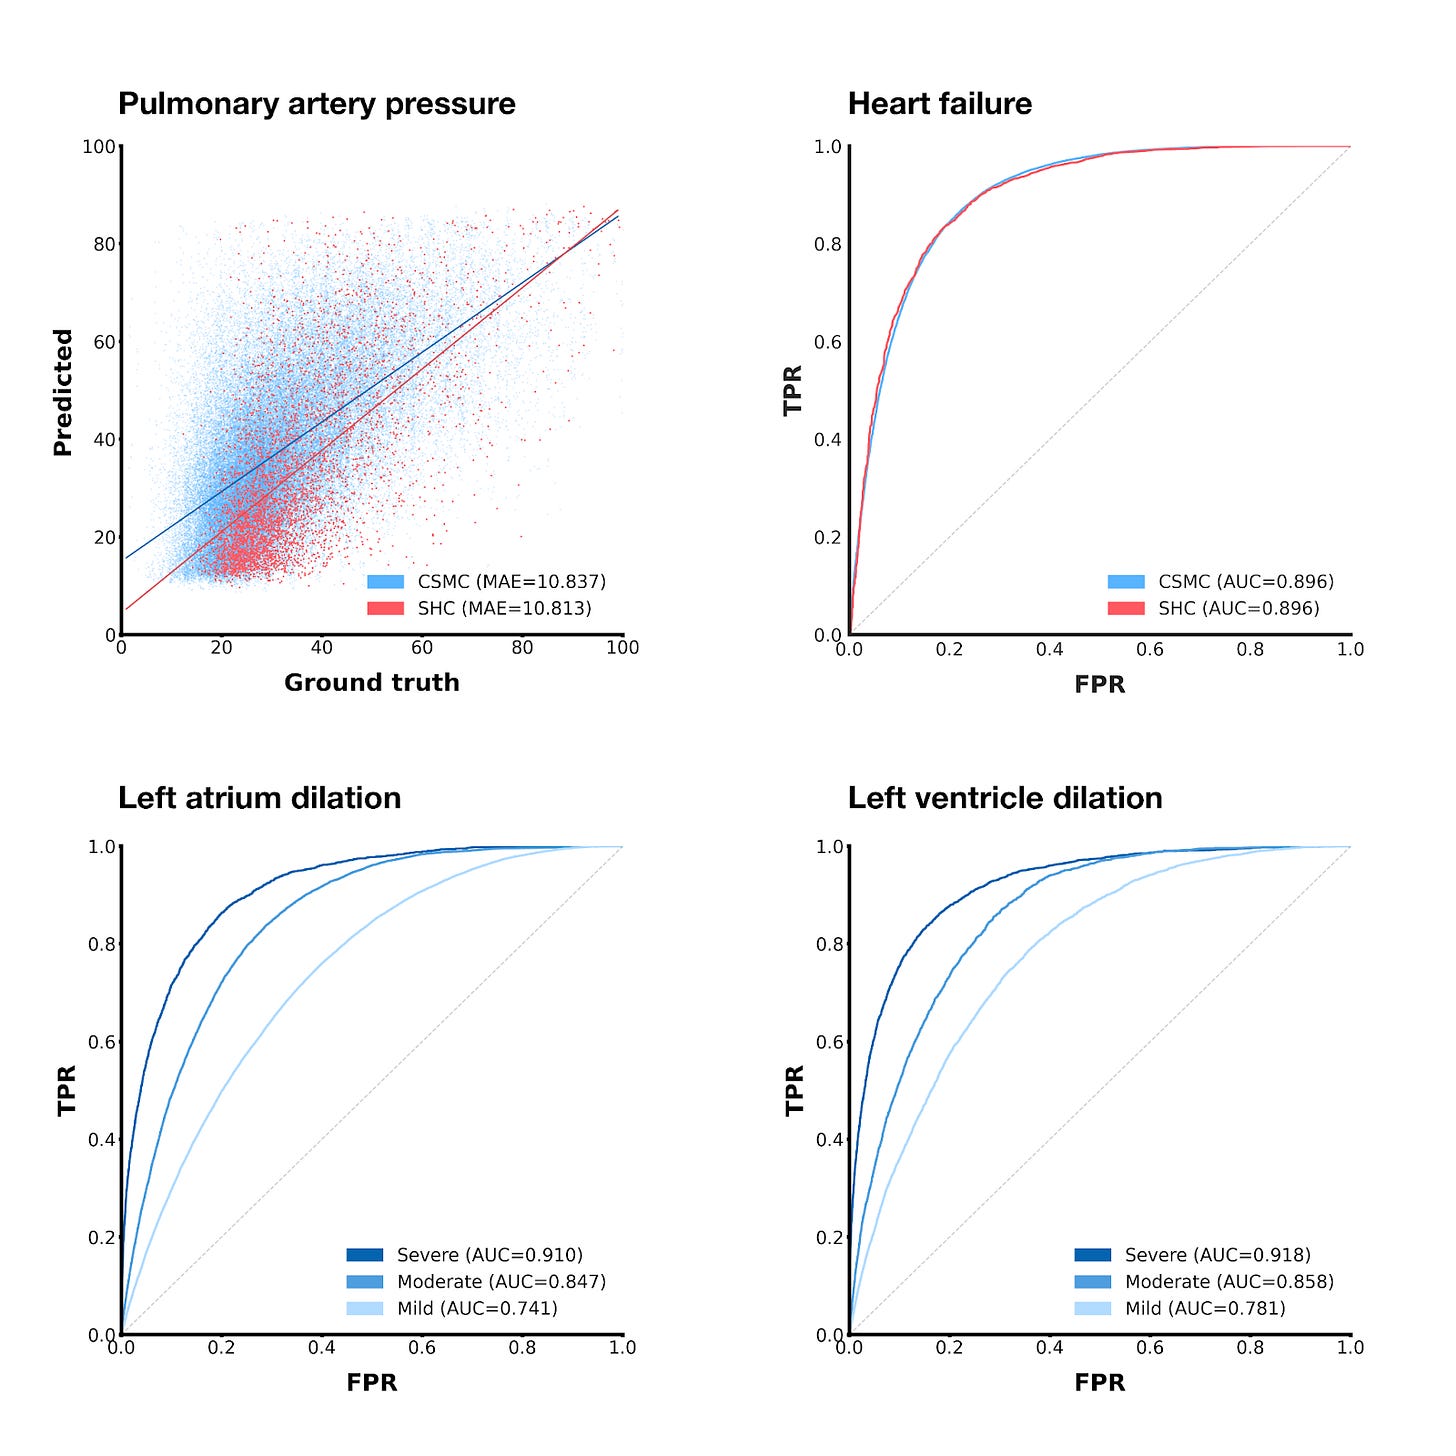
Here are a few other tasks we tested EchoCLIP on:
Using a similar technique as we did with ejection fraction, we can also get EchoCLIP to predict pulmonary artery pressure, albeit with slightly less impressive results.
If we threshold the zero-shot ejection fraction predictions at 50%, we can get a binary heart failure prediction
By using prompts in the vein of “Left/right atrium/ventricle is mildly/moderately/severely dilated”, we can predict whether different chambers of the heart are unhealthily large.
For the chamber size prediction tasks, EchoCLIP’s prediction performance improves as the severity of the condition increases, which makes sense—severe conditions do intuitively seem like they should be easier to detect.
The last type of task we tested EchoCLIP on is retrieval. It’s also the simplest of the tasks to implement.
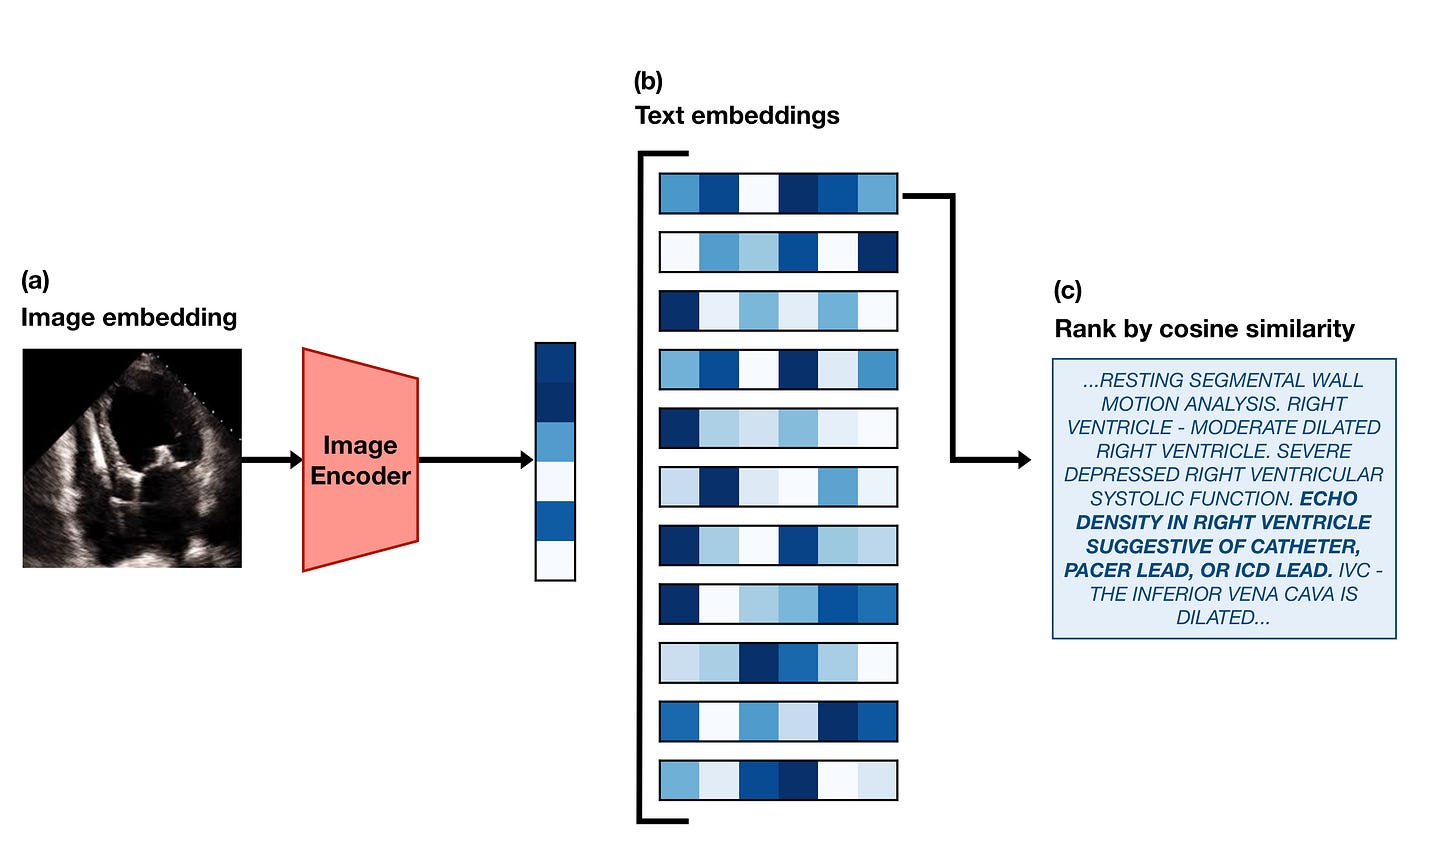
First, we take a frame from an echo in the test set and embed it using the EchoCLIP image encoder. Then we use the EchoCLIP text encoder to generate embeddings for every report in the test set. We calculate the similarity3 between the image embedding and all of the text embeddings, and “retrieve” the report that has the highest similarity. Here’s an example of what that looks like:
We believe this sort of functionality could be used in the future to create an easy way to search through the database of all of the hospital’s echocardiograms. Clinicians treating patients with a rare conditions might be able to more easily find echos from other patients with similar issues to refer to.
When it comes to retrieval, though, there’s one caveat I haven’t mentioned — we need embeddings for entire reports, but if you remember from earlier, EchoCLIP can only handle snippets of a report at time! To address this issue, we train and use a variant of EchoCLIP specifically designed for retrieval, which I’ll refer to as EchoCLIP-R. EchoCLIP-R is able to process entire reports because it uses a custom tokenizer tuned for efficiently tokenizing echo reports.
A tokenizer is just a way to turn text into numbers. Deep learning models take numbers (“tokens”) as input and produce numbers as output, so if we want to have them process text, we first need a process for converting text into numbers.
The way this is done in the original CLIP (and in the primary version of EchoCLIP) is by splitting the input into a list of words, and then converting pieces of those words into tokens according to a giant predetermined look-up table called a vocabulary. This system is great for capturing the wide variety of possible text inputs, but because each word is converted into at least one token, that means the length of the final input sequence can get very long very quickly.
We found that tokenizing entire echo reports frequently resulted in sequence lengths of over 700 tokens, which is far too long to realistically train on given our limited compute budget. Thus, for the primary variant of EchoCLIP, we decided to simply choose a random span of 77 tokens from each tokenized report and train the model on that. This worked very well as evidenced by the regression and classification tasks we’ve already covered, but it also meant that the model was not very good at retrieval. To retrieve the exact correct report to match with an echo out of >20k options, the model needs to see far more than just a snippet of the report.
So, in order to create EchoCLIP-R, we created our own tokenizer that was capable of compressing entire text reports into just ~50 tokens! The reason this was possible is because the text in echo reports is very repetitive. It’s often generated by cardiologists filling in blanks or choosing from a set of phrases in a template, so there are many phrases that are repeated verbatim across many reports. We exploited this to our advantage by obtaining a copy of the template used by the cardiologists who create the reports and manually constructing a small lookup table of around 900 phrases and sentences that were very common in the reports. Then, we built a tokenizer that would map those phrases and sentences to a single token each — stretches of text that would otherwise have been encoded as dozens of tokens now only took 1 or 2!
By using this custom tokenizer, we were able to train EchoCLIP-R using whole reports instead of just snippets of reports, which greatly increased its retrieval ability.
All of what I’ve written about so far is just touching the surface of what I believe is possible with multimodal models in healthcare. EchoCLIP is just the beginning, and we have a number of promising avenues to investigate for future research.
First and foremost — I want to expand this model to be video-based in the future. Currently, it operates only on singular still frames extracted from echos, but this means it’s missing out on a lot of useful information encoded in the videos’ time dimension. There are some tasks that the current EchoCLIP is bound to be horrible at simply because it can’t understand the concept of time. It’d be like asking someone to tell you how fast a car is moving based only off a single picture of the car — velocity is something you need temporal information to estimate! Human cardiologists rely on the whole echo video when making key diagnoses, so it makes sense that we should extend future versions of EchoCLIP to do the same.
Second, we want to try using future versions of EchoCLIP to directly generate reports for echo videos. There have been a number of papers published on the topic of using CLIP models for caption generation, but due to the already large scope of this paper, we have left the application of these methods to future work. Additionally, if we were going to actually try to generate captions, we’d need to find a way to ensemble predictions across all the videos in an echo study, since study reports describe all the videos in a study, not just the A4C ones.
Third, I would love to see if we could build real tools that real cardiologists can use that are powered by EchoCLIP. If EchoCLIP or EchoCLIP-R could speed up the echo-reading process, that might have a real positive impact on the lives of cardiac patients! We leave the construction and testing of such tools to future work.
This project has been slowly coming together for months at this point, and I’m quite excited that it’s finally out in the open and ready to be shared with the world. I’m also excited for the future of this tech and research.
Thanks for reading! If you’d like to read my non-work-related blog, you can find it here.
Bye for now!
~ Kai
The method described won’t actually work very well without a few key modifications, but including them in the blog post unfortunately made it feel too bloated and technical. If you’d like the nitty gritty details, you can find them in the paper.
Though if your model is consistently predicting the wrong answers, that means it actually still has predictive power—you just need to flip the predictions it makes! So it’s not really possible to perform “worse than random” in this case.
Cosine similarity, specifically—which for normalized vectors like our embeddings is literally just the dot product! It ranges from -1 when two vectors are exact opposites of each other to 1 when they are exact copies of each other.



Hey Kai, great post!
I am running a Discord community for practitioners tinkering with Multimodal AI research and applications.
Would love to have you join and share EchoCLIP with our members: https://discord.com/invite/Sh6BRfakJa
Incredible work congratulations!